Primary 3 Singapore math
Primary 3 Bar Graphs Made Easy
In this Practicle “Bar graphs for kids” guide, we are going to teach you everything you need to know when learning bar graphs in Primary 3 and turn you into a math pro!
What is a bar graph?
A bar graph is a picture that is made up of bars with different height. Each bar represents a different category. The height of each bar can tell us how often something happens or show us the number of items we have for each group. Now let’s see what we can use bar graphs for. Say you wanted to find out what your friends are doing at home during this covid period. After carrying out a survey, you might decide to put your results into a table like this:

Well, that’s one way of showing the data that you’ve collected. Another way would be to present the results in a more visual style using a bar graph. If you’ve done that, you’ll probably have a bar graph that looks like this:

As you can see, this bar graph has a few rectangular bars and there are many things that we can infer by comparing the bars. Let’s see what information we can tell by learning how to read this bar graph, ok?
How to read bar graphs
Bar graph example #1:

Reading bar graphs is really easy. First, we’ll start with the title. Reading the title of the graph will tell us what the bar graph is all about. This bar graph shows all the activities that a number of children are doing at home. Next, we are going to look at both the horizontal line and the vertical line. One of them will have some numbers that’s put on a scale while the other will tell us what categories we are looking at. When we look at the vertical line of this bar graph, we can see that each space represents 2 children. What about the horizontal line of the graph then? Well, you’ll see that the children are put into groups – those who were busy reading, those who spent their time playing, those who were baking with their mums and the rest were busy washing hands.
As you can see, this bar graph has a few rectangular bars and there are many things that we can infer by comparing the bars. Let’s see what information we can tell by learning how to read this bar graph, ok?
Bar graph example #2:
Here’s a table with some information. Do you know how to make a simple bar graph with this?

Once again, we are given the activities that a number of children are doing at home, so this should be the title of our bar graph.
Next, let’s think about what goes on the horizontal line and the vertical line. Looking at the table, we have different groups of children doing different things, right? And we are given the exact number of children in each group. So those 2 will be on each side of the graph.
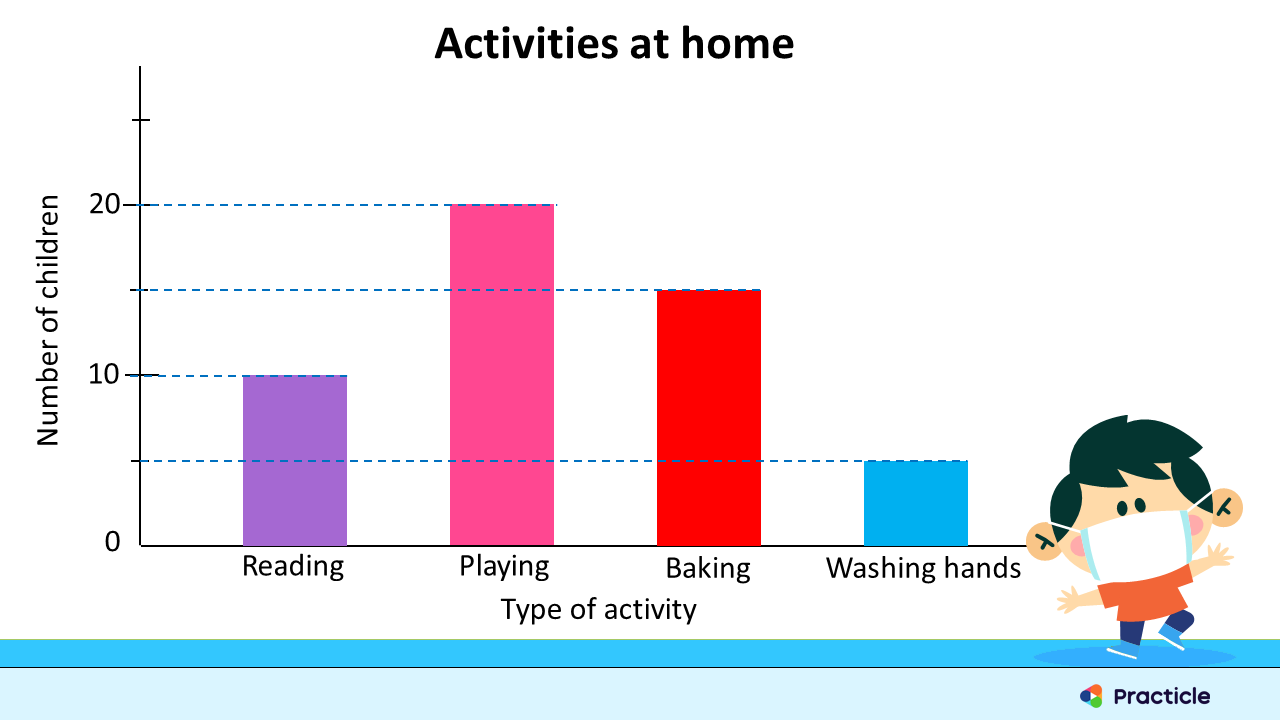
As you can see, this time round, 1 space on the vertical line represents a different value. Instead of having 1 space to represent 2 children, we now have 2 spaces to represent 10 children. This means that each space represents 5 children.
Bar graphs can be horizontal too!
So far, the bar graphs examples that we have seen have vertical bars. Do you know that the bars can be horizontal too? Let’s see how we can flip the lines around and draw a horizontal bar graph with the same information.
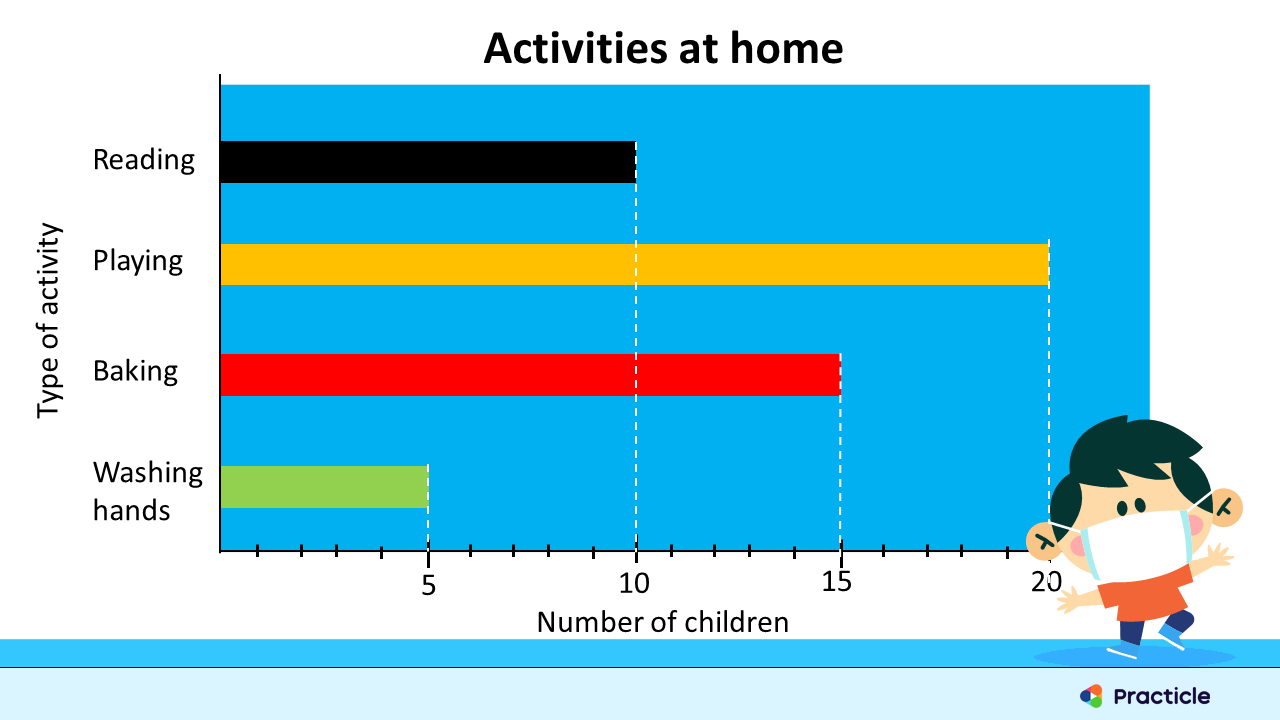
Not too hard, eh? Notice how we can use different scales to represent the number of children? In this example, we now have 5 spaces representing 5 children, so each space represents 1 child.
Ready to try out more Primary 3 bar graph questions?
Now that you got a better understanding of this Primary 3 Maths topic with your “bar graph for kids” guide, it’s time to test out your Math skills! Try out more questions on bar graphs with a free Practicle account today and see how good your Math skills really are!
Experience Practicle free, no commitment no hidden cost no lock-in
Try our learning platform free with a 7 day trial and see if your child likes it.